OSI Visualizer

OSI Visualizer serves as a visualization tool for the current implementation of OSI (Open Simulation Interface) messages. It supports GroundTruth, SensorView and SensorData messages and allows the visualization of two independent data channels using different input types (file and network stream). For more information see the documentation here.
Usage
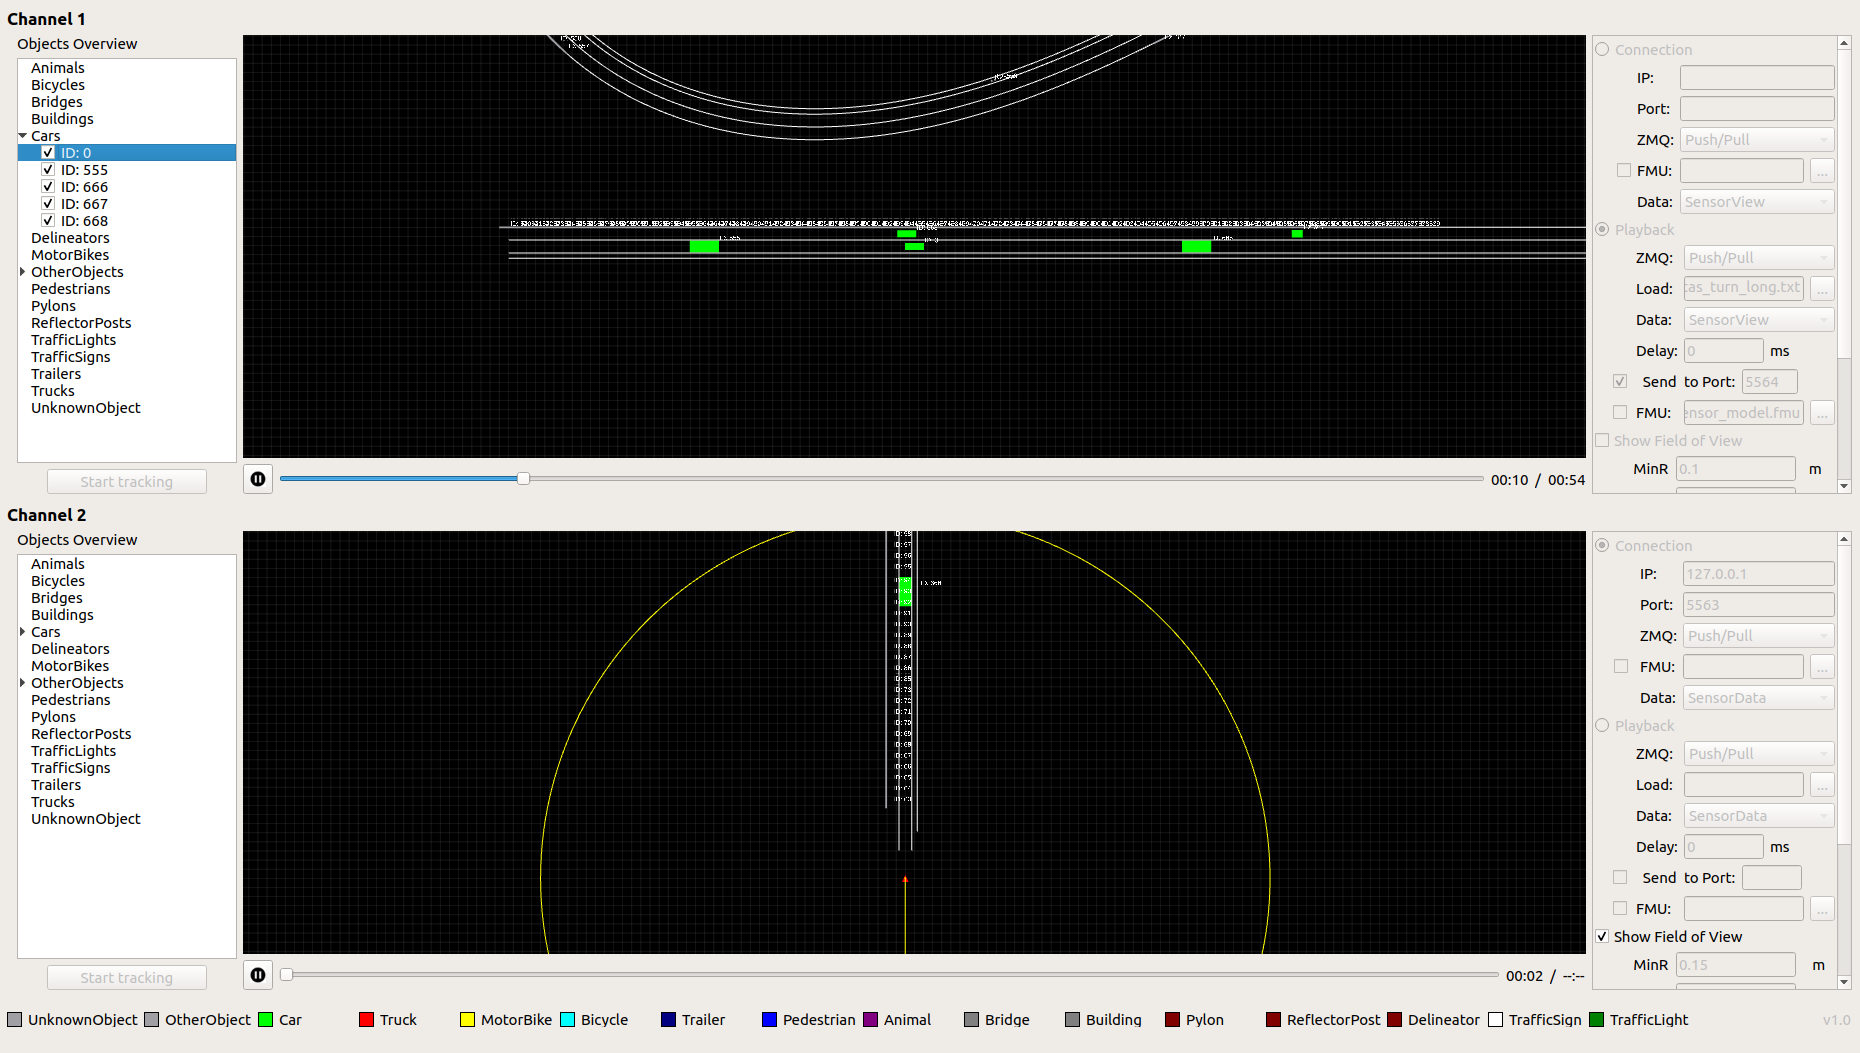
Use the configuration panel at the right (see Screenshot below) to load e.g. a playback file for channel 1 at Playback and choose a port to which it will be send (here 5564). Select the data type SensorView according to the content of the file. After that enter into the IP field the localhost and into the port field the receiving port (here 5563) for channel 2 in the panel below at Connection. Select the data type it is expected to visualize (here SensorData). In this example an intermediary on localhost processes the data from the input file using a OSMP sensor model, transforms it into SensorData and sends it to port 5563.
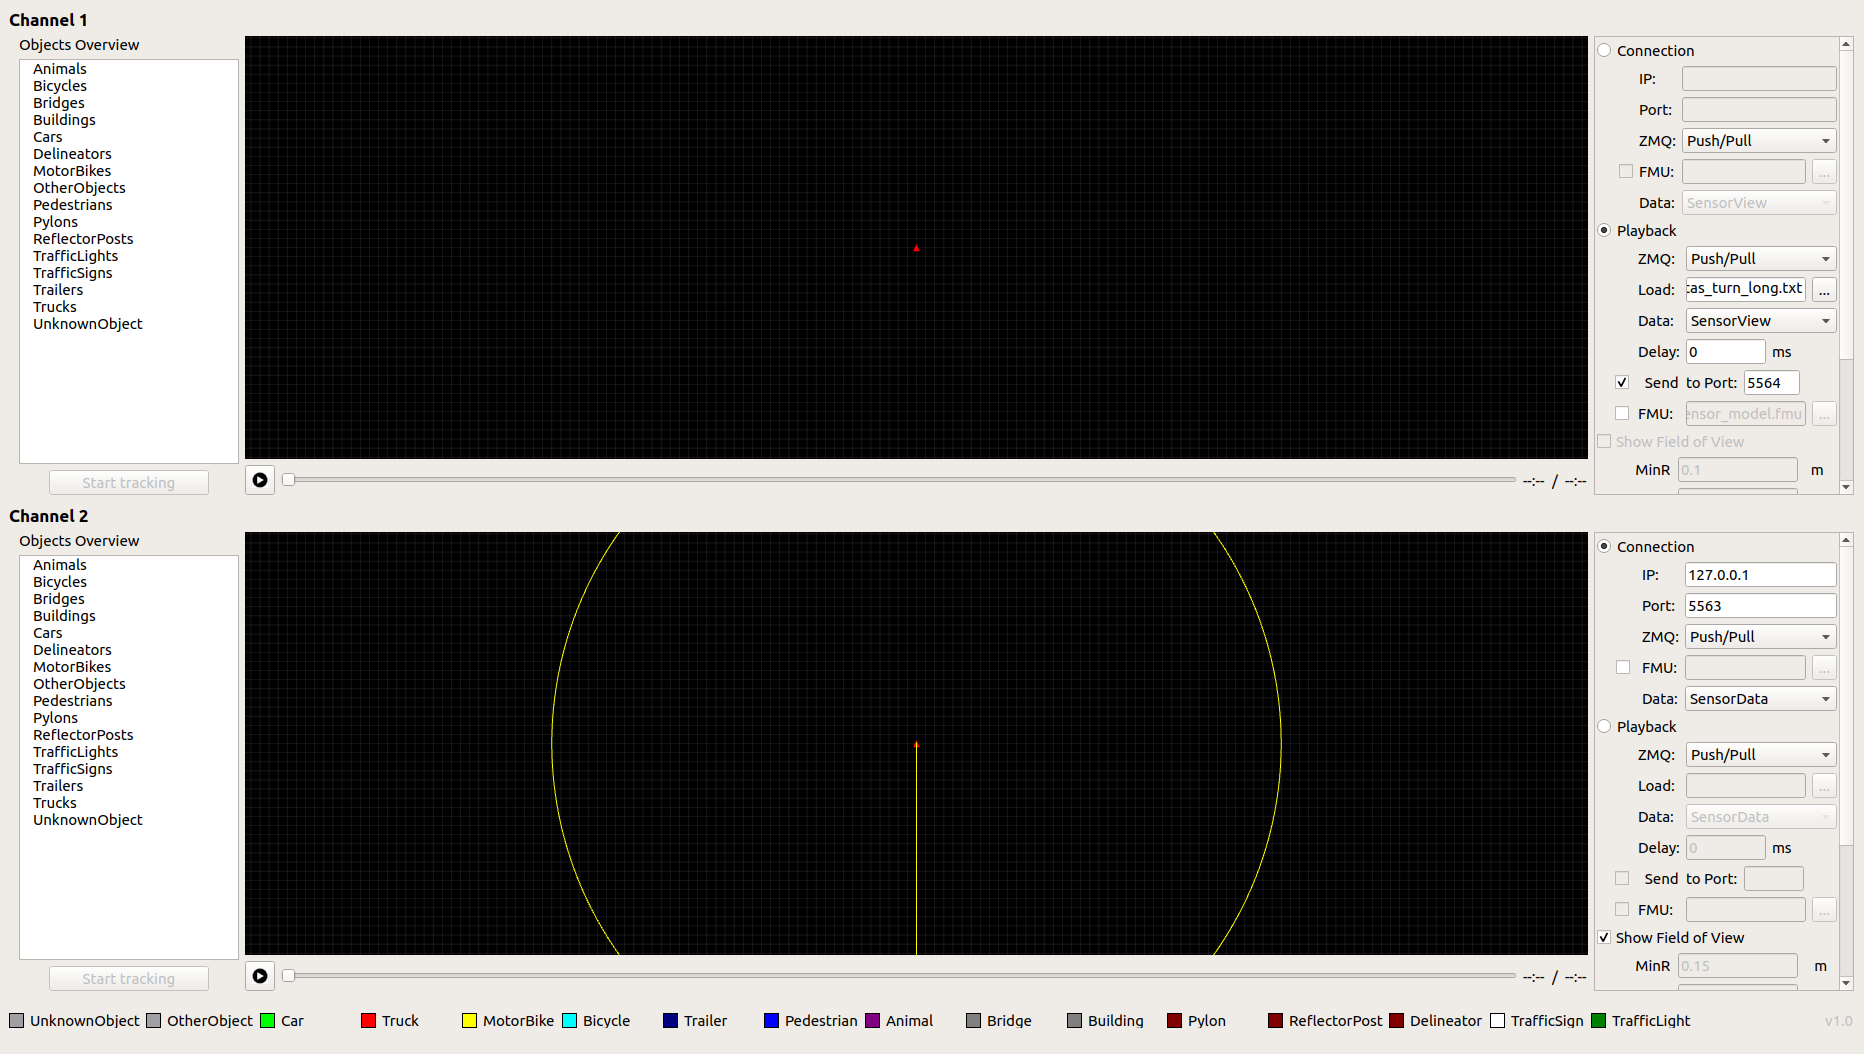
Now you can click on play for channel 1 and 2 and you can visualize the communication between these two channels. Channel 1 plays the selected OSI input file scenario and sends out the OSI message to port 5564 at the same time. Channel 2 visualizes the received OSI messages at localhost at port 5563 showing it on the canvas (see demo screenshot below).
Installation
Environment and dependencies
Currently we recommend users to use the osi-visualizer under Ubuntu Linux 18.04 LTS. You can see a working development environment based on Ubuntu 18.04 LTS in the Docker file in the repository.
Build and run
$ bash install.sh
or just manually if dependecies are already installed:
$ git clone https://github.com/OpenSimulationInterface/osi-visualizer.git
$ cd osi-visualizer
$ git clone https://github.com/OpenSimulationInterface/open-simulation-interface
$ mkdir build
$ cd build
$ cmake ..
$ make -j8
$ ./osi-visualizer